

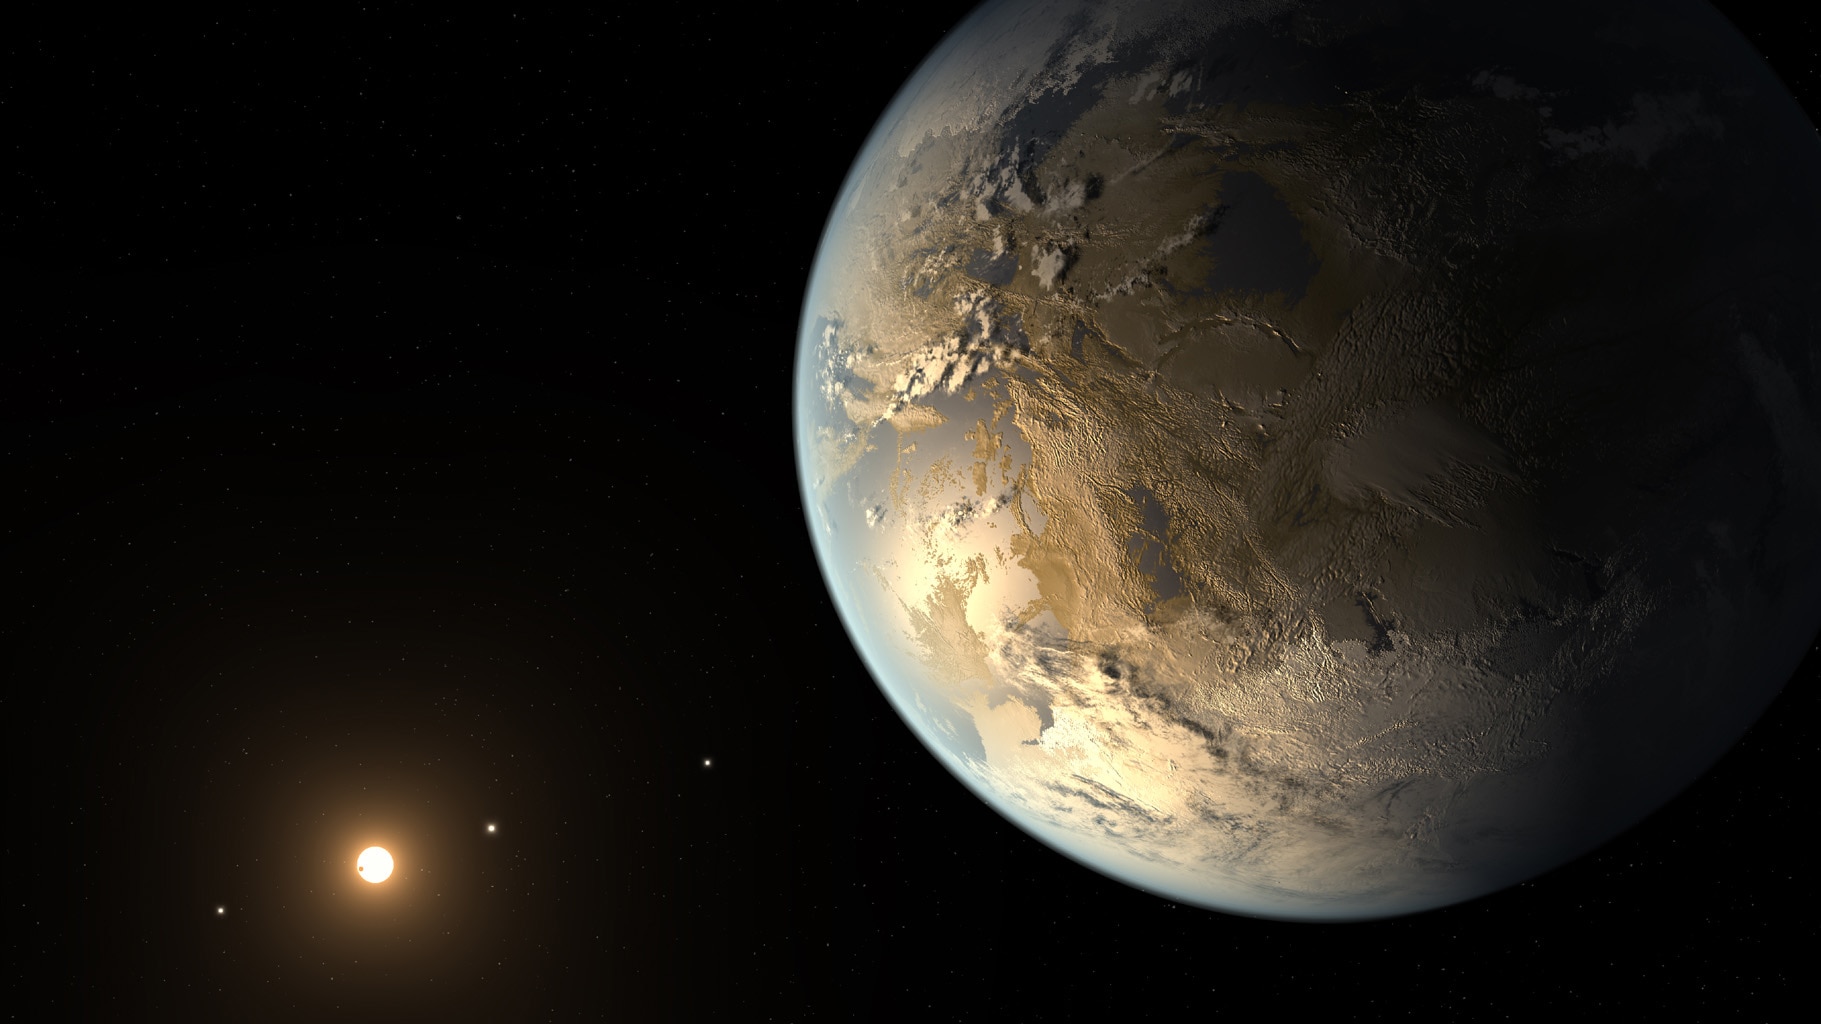
Project EDEN’s goal is to find potentially habitable planets around stars in our celestial neighborhood. We will share our findings with scientists around the world, so they can further study, explore, and possibly visit them one day. My job is to find nearby stars that work well with our detection level and that are most likely to host habitable planets. To create a manageable list of stars, I am using many different criteria to filter out some of these targets and narrow the scope of the survey. With fewer stars to review, we can observe each target longer and have a greater chance of discovering an exoplanet.

Venus passing in front of, or transiting, the Sun. Image from NASA.
First, I will explain Project EDEN’s primary method of detecting exoplanets. Our solar system lies approximately in one plane, so if we were to stand on Mars and look directly at the Sun, we would eventually see Earth pass in front of, or transit, the Sun, because it is crossing through the area directly between our eyes and the Sun. Instead of standing on Mars, however, Project EDEN is using telescopes located on Earth, and instead of staring at the Sun, we’re pointing the telescopes at other stars in the Milky Way. If the angle of the plane of planets in that solar system sits within the area formed between the telescopes and the star, we’ll be able to detect planets passing in front of the star. This method of exoplanet detection is called the transit method.
Using the transit method to detect planets around all the stars in our solar neighborhood would take decades because planets can take anywhere from a few hours to a few years to cross in front of a star. You have to point a telescope at a star for slightly longer than the entire transit to detect that planet in order to create a graph of the light of the star before, during, and after the transit. This is called a light curve.

Actual data of planet WASP-10b transiting in front of star WASP-10. Visual from Institute for Astronomy, University of Hawaii.
If we see a little dip in the data, we know that a transit occurred for the duration of the dip since the planet blocks that star’s light as it passes in front of it. If the transit is long, we have to spend a long time looking at the star without any breaks. However, the smaller a star is and the closer a planet is to that star, the shorter the transit. The more time you spend observing a star, the higher probability you have of witnessing a transit. However, it’s very expensive to purchase a large amount of time on the types of telescopes required for our research. That’s one of a few reasons why Project EDEN is beginning observations with a short list of 40 cool, small stars. I wrote a program to extract star data from the astronomical database Simbad, and dump it into a localized database.
Initially, we extracted the data of approximately 100 stars. Then, I removed known double or multiple-star systems, which make transit observations difficult. Imagine that the double stars are like two bright light bulbs less than an inch apart. If we pass a tiny object in front of them (our exoplanet), it would be difficult to distinguish how much light one of the bulbs emits because you’re also receiving light from the other bulb. Finally, I reduced the database to 40 stars by choosing the 20 closest stars in each hemisphere since EDEN is focused on nearby exoplanets.

Gaia’s most recent all-sky map, colorized.
Going forward, I plan to collect more information on each of the 40 targets, such as mass and radius. Additionally, the second Gaia Data Release will be a great resource for us. Gaia is attempting to create a 3D map of the Milky Way, so it may provide us with information like distance that many stars in Simbad do not already have.
Working on Project EDEN as a first-year undergraduate student has been a steep, but extremely interesting and rewarding learning curve. I had to greatly expand my knowledge of the programming language Python, as well as observational astronomy concepts. Even though I’ve been part of EDEN for more than six months now, I still have a hard time believing that I’m actually playing such an important role in the search to find life on other planets. I am excited to begin observing the stars selected in the first project phase. I look forward to continuing my work as EDEN grows larger and more developed as we move into the future.

 wide view of a particular portion of the night sky. So, to go around this problem, astronomers instead focus their telescopes on a much brighter star that is in the celestial neighborhood. By focusing the telescope on that guide star, combined with the larger field of view, whenever the telescope takes an exposure the target star is somewhere in the image. Focusing on the brighter target also leaves less room for the tracking system to vary as it moves through the night sky.
 mass, while the stars that make large circles have a higher air mass. Every star that is observable during any particular season has an ‘air mass curve’ as the star moves in the sky over the night. At the peak of this curve is how close the star gets to the minimum of 1.00.Using the air mass curve, we can then plan when we observe a target and for how long we can observe it. For reference, we can get really good data whenever we observe a target when it is below 1.50 air mass. So, we look at the air mass curve of the target, and only observe it when it is high enough in the sky. Every night of the year this curve shifts for every star, some more than others. Whenever the air mass curve of a star shifts so far that it peaks during the day, we say that the star is ‘out of season.’ We can then plan observations months in advance, picking targets that are in season and have a low enough air mass.
 into the next stage of our observations, which is to observe stars looking for previously-unknown exoplanets. This is an incredible time to be alive. These stars are out there, and we are gazing upon an ocean of limitless mystery and wonder.


Recent Comments